Site perso : Emmanuel Branlard
Next: Dipole points definition | Up: Introduction | Previous: On the RMS definition and notation |
Navigation: Contents | Index
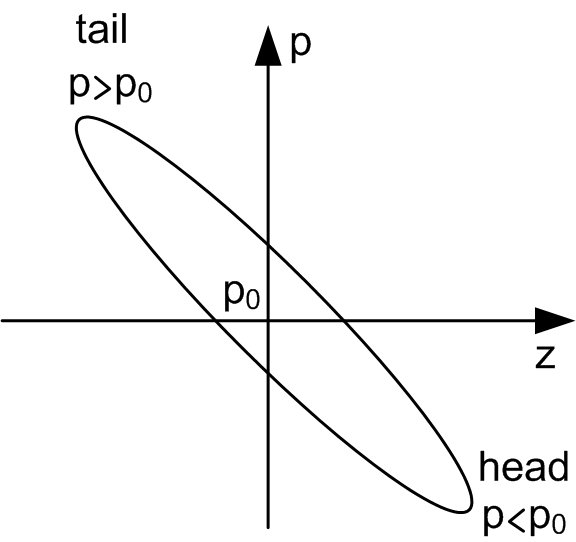
Phase space convention used
|
Next: Dipole points definition | Up: Introduction | Previous: On the RMS definition and notation |
Navigation: Contents Index