Site perso : Emmanuel Branlard
- 9.4.1 Analysing the previous algorithm without the source code
- 9.4.2 Modifying the source code to output a standard sigma matrix
9.4 Note on the sigma matrix outputed by Astra
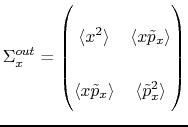
The reader is invited to read chapter 3.2 for a better understanding on beam matrix and emittance. For convenience, we recall here some formulas:
| (9.4) |
 |
(9.5) |
| (9.6) |
 |
(9.8) |
9.4.1 Analysing the previous algorithm without the source code
Philippe Piot added to Astra the functionnality of outputing the ![]() matrix if the option
matrix if the option
SigmaS is specified in the &NEWRUN section of the run file. The structure of the output file is specified in table 9.1. The matrix being symmetric only 21(
![]() ) coefficients need to be stored. The two first columns contain the
) coefficients need to be stored. The two first columns contain the ![]() position and the energy. The following 21 are the matrix coefficients.
position and the energy. The following 21 are the matrix coefficients.
|
A sigma matrix can be written in different units, and attention has been paid to plot the ellipse with the right dimension and units on each axis. To check this, we calculated directly the sigma matrix from the distribution, and we compared it with the matrix outputed by Astra. We did this for two cylinders with with two different normalized transversal emittances :
![]() mrad.mm and
mrad.mm and
![]() mrad.mm. See table 9.2 for more information on the distributions.
mrad.mm. See table 9.2 for more information on the distributions.
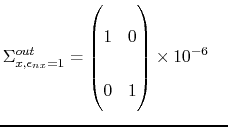
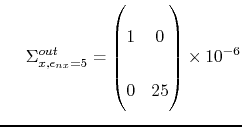
The 2D x-block of the matrix outputed by astra were:
 and and |
(9.9) |
One can easily notice that the square root of the determinant of these matrix provides the normalized emittance in [m.rad]. From the input distribution, the values
 |
(9.10) |
Nevertheless, the canonical variables in phase space are
| (9.11) |
where the product
| (9.12) | |||
| (9.13) |
The correponding ellipse is plotted with horizontal and vertical units being respectively [m] and [MeV/c]. For the phase space
 |
(9.14) |
where
![$\displaystyle \langle \tilde{p}_z \rangle \; [.] = \frac{ \langle p_z \rangle \; \text{[MeV/c]} }{0.511\; \text{[MeV/c]}}$](img564.gif) |
(9.15) |
So that eventually, the
 |
(9.16) | ||
 |
(9.17) |
The corresponding ellipse is plotted with horizontal and vertical units being respectively [m] and [rad].
To illustrate the difference between the ellipse representation and the real distribution in the phase space we chose first to use a uniform distribution of particules in the transversal direction. In this case, if
![]() [mm], the radius of the bunch will be
[mm], the radius of the bunch will be
![]() . This is observed on figure 9.1 for the three sets of parameters
. This is observed on figure 9.1 for the three sets of parameters ![]() ,
, ![]() , and
, and
![]() . One can verify that the RMS values (i.e. the ellipse semi-axes)
. One can verify that the RMS values (i.e. the ellipse semi-axes) ![]() ,
, ![]() correspond exactly to the values contained in the files run.Xemit.001 and run.Yemit.001, confirming that the algorithm plotting the ellipses from the covariance matrix it consistent.
correspond exactly to the values contained in the files run.Xemit.001 and run.Yemit.001, confirming that the algorithm plotting the ellipses from the covariance matrix it consistent.
 (a) (a)
 (b) (b)
 (c) (c)
|
 (a) (a)
 (b) (b)
|
9.4.2 Modifying the source code to output a standard sigma matrix
The main part of this work was not the implementation itself, but the understanding of the units and dimensions as well as what should be plotted as an ellipse in the phase space. The previous section, might be a little hard to read, but it really translates the methodical approach used to be sure that we output and plot the right sigma matrix / ellipse. After modification of the fortran source file X_em_mon.f, Astra is now outputing a file run.Sigmas.001 which has the following structure (table 9.3).
|
